
Storage News
Self Storage Cap Rates in 2026: What They Are and What Moves Yours
The sector average sits at 6.59%. Here is what that does to your valuation, and the five operating numbers a buyer checks before they price it.

Written by: Miles Davison
Data validated by: Storeganise team
Published: 24 October 2026
Updated: 24 October 2026
Self storage cap rates in 2026: where they stand
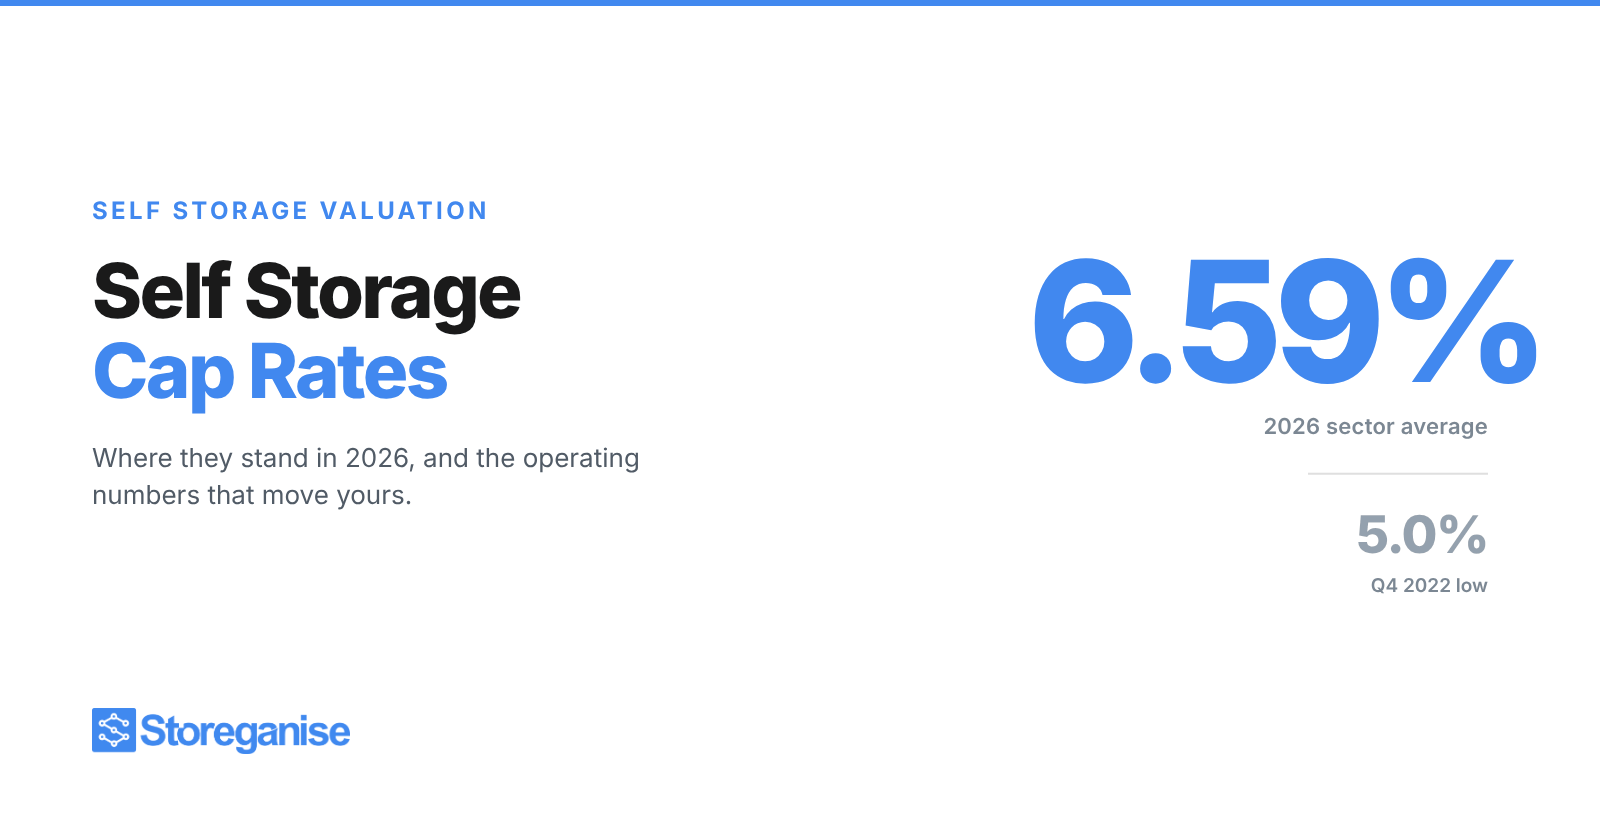
The sector average self storage cap rate stood at 6.59% in 2026, according to Marcus & Millichap's US Self-Storage Outlook. That is roughly 160 basis points above the all-time low of 5.0% the sector hit in the fourth quarter of 2022, a figure recorded by Cushman & Wakefield. Cap rates rose because the cost of money rose, not because self storage stopped working.
For an owner, that gap is the whole story. The same facility producing the same net operating income is worth meaningfully less at 6.59% than it was at 5.0%, and nothing about how you run it changed.
Key takeaways
- The sector average cap rate was 6.59% in 2026, against an all-time low of 5.0% in Q4 2022.
- Cap rates expanded mainly because Treasury yields rose. The 10-year reached 4.76% in late August 2026.
- Brokers band facilities roughly 5.5% to 6.5% for Class-A in primary markets and 7.5% to 8.5% for Class-B/C in smaller markets, though published bands vary by source.
- Value is trailing-12-month NOI divided by the market cap rate, so a $400,000 NOI at 6.5% is about $6.15 million.
- You cannot move the market cap rate. You can move your NOI, your expense ratio and the credibility of your numbers, and those decide the price you actually get.
- Transaction activity recovered in 2026, with sales up nearly 20% year over year as of June, but trades above $20 million remained 65% below 2022 levels.
How a cap rate actually sets your facility's value
Self storage cap rates are not a score. A capitalization rate is the annual return a buyer expects from a property bought with cash, and it works as a divisor:
Value = trailing-12-month NOI ÷ market cap rate
A facility throwing off $400,000 in net operating income, valued at a 6.5% cap rate, is worth about $6.15 million. Move the cap rate to 7.5% and the same $400,000 buys a valuation of roughly $5.33 million. You lost $820,000 without a single tenant moving out.
That sensitivity runs both ways, and it is why the cap rate conversation matters more than most operators think. Every 100 basis points of movement is worth about 13% to 15% of your facility's value at these levels, which dwarfs most of what shows up in a year of profitability work.
Net operating income here means revenue after operating expenses, before debt service, depreciation and capital expenditure. Buyers rebuild it from your statements rather than accepting your number, which is the part most owners underestimate.
What moved cap rates from 5.0% to 6.59%
Three things, in rough order of weight.
The cost of money. Cap rates track the risk-free rate with a spread on top. When the 10-year Treasury climbed to 4.76% in late August 2026, the spread that made a 5.0% cap rate rational in 2022 stopped existing. Marcus & Millichap notes the spread between cap rates and benchmark rates compressed in 2026 mainly because Treasury yields rose, not because asset pricing improved.
Supply catching up with demand. Deliveries ran hot through the post-2020 boom and rents have not recovered. Average asking rents were projected to fall 0.8% in 2026, to roughly $1.18 per square foot, leaving them about 11% below the 2022 peak.
Values repricing to match. Cushman & Wakefield recorded values declining for six consecutive quarters to an average of $159.00 per square foot in Q2 2025, 12% below the peak. Over the six quarters to that point, the average cap rate sat at 5.8%, already well above the trough.
The supply picture is now turning. Inventory growth was forecast at 2.2% for 2026, the smallest delivery slate since 2016, with first-half completions of nearly 27.8 million square feet, the lowest first-half volume since 2014. Less new supply is the condition rents need to recover.
Cap rate bands by facility class
Sector averages hide an enormous spread. Self storage cap rates for a new climate-controlled facility in a top-25 metro and an older drive-up site in a tertiary market do not sit anywhere near each other.
Brokers band them roughly like this. These ranges come from CT Acquisitions, a self storage brokerage, and are a broker's working framework rather than survey data:
| Facility profile | Typical cap rate | Implied NOI multiple |
|---|---|---|
| Class-A, primary market. Top-25 MSA, built 2010 or later, 50-70% climate-controlled | 5.5% to 6.5% | About 15x to 18x |
| Class-A secondary, or Class-B primary. Top 26-100 MSA, or older primary-market assets, 30-50% climate-controlled | 6.5% to 7.5% | About 13x to 15x |
| Class-B/C, secondary and tertiary. Smaller MSAs, 0-30% climate-controlled, older construction | 7.5% to 8.5% | About 12x to 13x |
| Lease-up or value-add | Stabilized exit cap plus 100 to 150 bps | Priced on trailing performance |
Lease-up assets price wider for a reason worth understanding if you are still filling a new build. Until the rent roll stabilizes there is no trailing NOI to capitalize, so a buyer prices the risk instead, which is the same logic a lender applies in a feasibility study.
Treat any published band as a starting point and not a quote. Bands differ between sources, and the same brokerage's own materials can disagree with each other by half a point. What settles your number is comparable sales in your market in the last six to twelve months, which is a conversation with a broker who has actually closed them.
One pattern does hold across sources: climate-controlled mix matters. Climate-controlled units command meaningfully higher rent per square foot than drive-up, so a higher climate mix supports a tighter cap rate.
The operating numbers that move your cap rate
You do not set the market. Self storage cap rates are decided by capital markets and comparable sales, and no amount of good management moves them. What you set is the numerator, and how much a buyer trusts it.
This is where the conversation gets useful for an operator rather than an investor, because every line below is something you can look up in your own reporting this week.
| What a buyer checks | Why it moves the number | Where to find it |
|---|---|---|
| Physical occupancy | Stabilized pricing generally assumes 85% to 92%. Below roughly 75% and the facility is underwritten as lease-up, at a wider cap rate | Occupancy by unit and by square foot |
| Economic occupancy | Should sit within 5 to 10 points of physical. A wide gap says your rent roll is propped up by discounts | Actual revenue against revenue at full rate |
| Operating expense ratio | Commonly 28% to 38% of effective gross income. Above the band invites a buyer to rebuild your NOI downward | Expenses as a share of collected revenue |
| Ancillary revenue share | Tenant insurance and retail typically contribute 4% to 7% of total revenue under professional management | Insurance and merchandise revenue lines |
| Rent roll trend | A declining 24-month occupancy curve gets priced sharply down, whatever the current snapshot says | Month-by-month occupancy and revenue history |
| Data quality | Clean, reconciled platform data shortens diligence and removes the discount a buyer applies to uncertainty | Your management system's reports |
The last row is the one owners dismiss and buyers do not. An underwriter who cannot reconcile your reported revenue to your bank statements does not split the difference. They assume the lower number and price accordingly.
If your reporting lives across a spreadsheet, a separate payments record and a manager's memory, that is a valuation problem rather than an admin problem. Operators running on a single platform can export a trailing-12 revenue and occupancy history in minutes, which is also the first thing a broker will ask you for. Our reporting and analytics page covers what that looks like in practice.
What you can change in the twelve months before a sale
A sale process rewards preparation that started a year early. In rough order of impact:
Close the economic occupancy gap. If physical occupancy is 90% and economic occupancy is 78%, you are discounting twelve points of revenue. Working that gap down lifts NOI directly, and NOI is the number that gets multiplied. Our guide to tracking the right business metrics sets out how to measure both properly.
Clean up the expense line. Buyers normalize expenses against market. Owner salaries, related-party contracts and deferred maintenance all get adjusted, usually against you. Categorize honestly now rather than arguing about it in diligence. Tracking expenses properly is the groundwork.
Build the ancillary lines. Tenant insurance attach rate and retail sales are high-margin and flow almost entirely to NOI. Moving ancillary revenue from 2% of total to 5% on a $1 million-revenue facility adds roughly $30,000 of NOI, which at a 6.5% cap rate is about $460,000 of value.
Fix deferred capital expenditure. Roofs, doors and paving get inspected. A buyer who finds $200,000 of deferred work does not reduce their offer by $200,000. They reduce it by more, because the finding makes them question what else they have not seen.
Make your data defensible. Reconciled statements, a clean trailing-24-month history and consistent definitions. This costs nothing and removes the uncertainty discount.
Note what is not on that list: raising street rates in the final quarter. Underwriters look at trailing twelve months, not your newest rate sheet, and a late spike reads as window dressing.
Related article: Self storage design decisions that set the ceiling
Where self storage cap rates go next
The near-term consensus is flat. In Cushman & Wakefield's investor survey, 56% of more than 40 self storage experts expected little to no change in cap rates over the following twelve months.
The market signals underneath are mixed but improving. Transaction activity recovered in 2026, with sales activity up nearly 20% year over year as of June and total deal volume up nearly 50%. The large end stayed quiet, with trades above $20 million running 65% below 2022 levels. Vacancy was forecast to fall 20 basis points year over year to 10% by the end of 2026, and stabilized rents had recovered to within half a percent of recent highs even as asking rents slipped.
Read together, that is a sector finding a floor rather than one rebounding. For an owner, the practical conclusion is that waiting for 5.0% cap rates to return is not a strategy. Cap rate compression of that scale needed an interest rate environment that no longer exists.
What you control is the numerator. A facility with a credible trailing-twelve, a tight economic occupancy gap and a defensible expense ratio sells near the top of its band. The same building with messy numbers sells near the bottom, and the difference between those two outcomes is usually larger than the difference between a 6.5% and a 7.0% market cap rate.
If you are planning an exit in the next two years, the work starts with knowing your own numbers well enough to defend them. Our reporting and analytics tools are built for operators who need that history on demand, and the owners and CEOs overview covers what portfolio-level visibility looks like.
Sources
- Marcus & Millichap, US Self-Storage Outlook 2026: Vacancy Improvement Emerges as Development Slows, September 2026
- Cushman & Wakefield, US Self Storage: Market Trends & Sector Outlook, H1 2025 data
- CT Acquisitions, Self Storage Business Valuation (2026): Cap Rates by Facility Tier, updated October 2026
The ultimate guide to setting up in self storage
New to self storage, like Banana Box was? The practical playbook for new operators, from choosing the site to landing your first tenants.
Choosing the right location and size
Pricing that fills units and protects revenue
Security, insurance and legal essentials
FAQs
What is a good self storage cap rate?
There is no single good number, because a cap rate prices risk rather than quality. Class-A facilities in primary markets trade tighter than older assets in smaller markets. A lower cap rate means a higher valuation for the same income, so sellers want tight and buyers want wide.
What is the average self storage cap rate this year?
The sector average stood at 6.59% in 2026, according to Marcus & Millichap. That is roughly 160 basis points above the all-time low of 5.0% recorded in the fourth quarter of 2022. The expansion tracked rising Treasury yields rather than any weakening in self storage demand.
How do you calculate the value of a self storage facility?
Divide trailing-12-month net operating income by the market cap rate. A facility producing $400,000 in NOI at a 6.5% cap rate is worth roughly $6.15 million. NOI here means revenue after operating expenses, before debt service, depreciation and capital expenditure.
Do cap rates go up when interest rates rise?
Generally yes. Cap rates sit above the risk-free rate with a spread for property risk, so rising Treasury yields push them up. The 10-year Treasury reached 4.76% in late August 2026, which compressed the spread and kept cap rates elevated against their 2022 lows.
What cap rate do Class-B facilities trade at?
Broker frameworks put Class-B assets in primary markets around 6.5% to 7.5%, and Class-B/C in secondary and tertiary markets around 7.5% to 8.5%. Published bands differ between sources, so treat any range as a starting point rather than a quote.
How can I improve my facility's valuation before selling?
Close the gap between physical and economic occupancy, normalize your expense ratio, grow ancillary revenue, and clear deferred maintenance. Then make the numbers defensible with reconciled statements and a clean trailing-24-month history. Raising street rates in the final quarter does not work, because underwriters price the trailing twelve.